
How Krillion Roster Size Changes the Saved Tier Mix
Krillion’s saved tier mix changes sharply with roster size. Across 525 prompt instances and 129,424 recorded entries, the average share labeled Deep Cut rose from 19% in rosters under 30 entries to 87% in rosters with 500 or more.
That describes how the saved roster was graded. It is not a player’s chance of scoring 85 points.
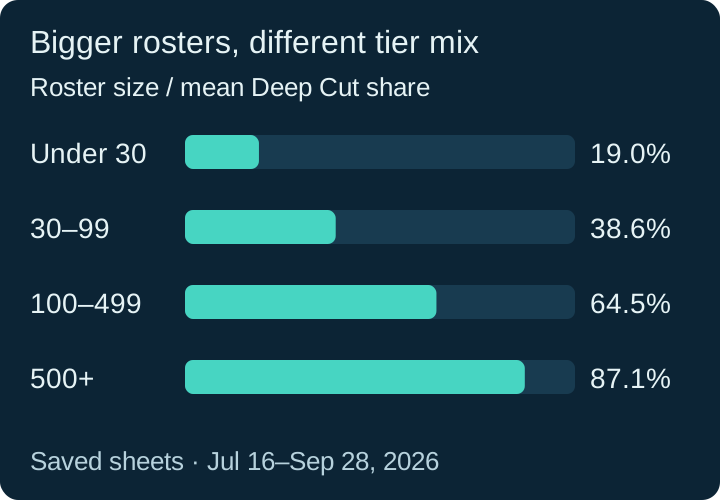
Four roster-size bands
For each prompt, we divided its number of Deep Cut entries by its total roster size, then averaged those prompt-level shares inside a size band. This keeps one 9,000-entry roster from swallowing every smaller prompt in the average.
| Saved roster size | Prompt instances | Mean Deep Cut share | Mean 100-point entries |
|---|---|---|---|
| Under 30 | 57 | 19.0% | 0.81 |
| 30–99 | 252 | 38.6% | 1.13 |
| 100–499 | 149 | 64.5% | 1.32 |
| 500 or more | 67 | 87.1% | 1.43 |
The association is strong in this dataset: the Pearson correlation between the natural log of roster size and each prompt’s Deep Cut share is about 0.83. Log size is used because the rosters range from 9 to 9,373 entries.
Why this differs from the overall 78.4% figure
Across all rosters combined, 101,479 of 129,424 entries are Deep Cuts: 78.4%. That calculation weights a 9,373-entry roster much more heavily than a nine-entry roster. The table above instead gives each prompt one equal vote within its size band.
A small arithmetic example makes the difference clear: suppose one roster has 9 Deep Cuts out of 10 and another has 10 out of 100. The average of the two prompt-level shares is (90% + 10%) ÷ 2 = 50%. Combining the entries gives 19 ÷ 110 = 17.3%. This is an illustrative example, not two actual Krillion rosters.
Reading the bands correctly
Under 30 entries
These are often closed lists: a country by starting letter, a short set of bordering countries, or another tightly defined group. All 14 prompt instances without a 100-point entry fall in this band; their saved roster sizes range from 9 to 20. See the dated list and score ceilings. A valid answer can still occupy any displayed tier; the small roster does not guarantee a high score.
30–99 entries
This band contains many familiar named categories. The saved rosters average 38.6% Deep Cut entries, leaving substantial space in Rare, Schooler, Too Clever and Plankton.
100–499 entries
The saved Deep Cut share rises to 64.5%. These prompts provide more room for uncommon valid entries, but an obvious answer can still appear at the bottom tier.
500 or more entries
The broadest saved rosters average 87.1% Deep Cut entries. On September 24, one “animal without the letter A” roster stored 9,373 entries. That says the curator placed most of a huge candidate set in Deep Cut; it does not mean a player choosing an answer at random has an 87% success rate, because player choices are not random samples of the roster.
What this changes in practice
Use roster size as a review clue, not a promised score. After a round:
- a tiny list helps explain why familiar entries can still sit relatively high;
- a huge list helps explain why the saved sheet contains thousands of obscure entries;
- the exact prompt wording and dated tier remain the final source.
The Hints page shows the latest saved roster count and tier totals without displaying answer text immediately. For older dates, open the prompt in the Archive.
Check a source row yourself
Compare countries beginning with I on September 12 with the September 24 animal prompt. The full source URLs, entry totals and tier counts are also in the downloadable prompt CSV. To reproduce a band mean, divide each row’s deep_cut count by its entries count, then average only the rows in that size band.
Data limits
This fixed study covers July 16–September 28, 2026. It counts saved answer entries, not player submissions, impressions or familiarity measurements. It does not estimate the probability that any person will remember a valid answer within 25 seconds. Rosters are dated snapshots and can differ from later versions of similar prompts.